Material to support a paper at VOILA! 2022
Graphically construct and execute rich data analysis queries over DBPedia and other RDF Data Sets.
 |
Google Chrome browser is recommended (may work also in other browsers).
Register (sign up) as a new user (email checking not done, any e-mail-like string is accepted), then log in.
Create a new project (give at least the name for the project), initialize your project by the predefined DBPedia QALD project ('Initialise by DBPedia QALD 9 queries'). If an empty project is created, its contents can be uploaded (button 'Upload Project') later from a sample project file or URL, as e.g., DBPedia QALD 9 sample project.
The diagrams with QALD 9 queries shall be loaded and can be clicked to open. New diagrams can be created, as well. The tabs for classes, properties and individuals shall be to the right of the diagram. Double-click an item in a list to seed a query from it.
The project file can be separately downloaded (in JSON-based abstract syntax).
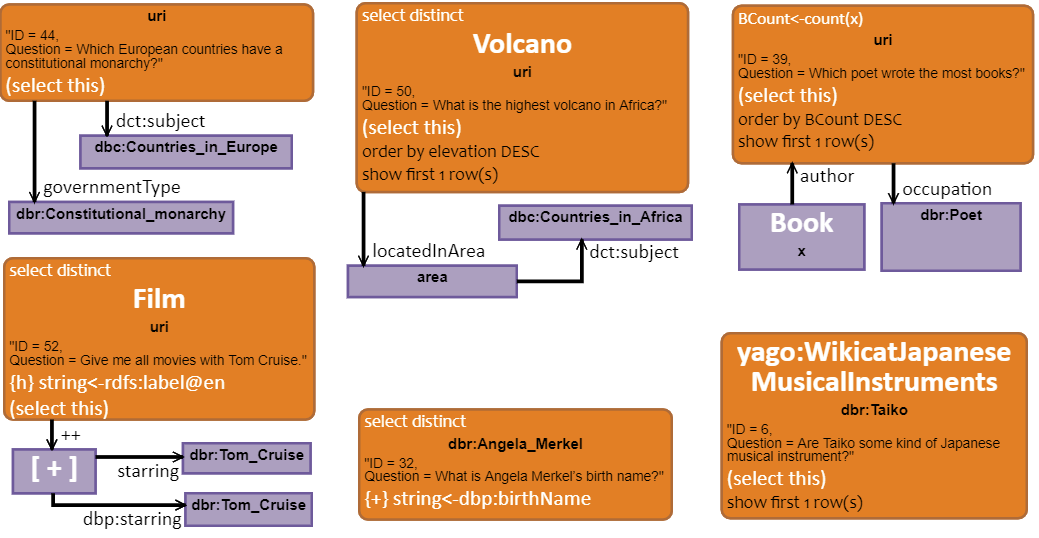
Analysis of DBPedia QALD example SPARQL query visualizations (.pdf)
The original QALD-9 queries are available here.
The students were handed out 9 query formulations in natural language and they were asked to create the visual query formulations. There were no time pressure on the participants, as the queries were asked to be filled in the form of an extra homework.
The study results are summarized here
(successful queries by students (out of 9): 9,9,8,8,8,8,7,6,5,5;
successful students per query (out of 10): 10,10,10,10,9,9,6,6,3);
the problems arising from not using the best properties corresponding to the informally stated terms, as discussed in the paper).
The code for data shape server (serving the names for auto-completion) is in its own repository on GitHub.
The ViziQuer main page describes open source tools for data schema population (retrieval), as well.