|
|
|
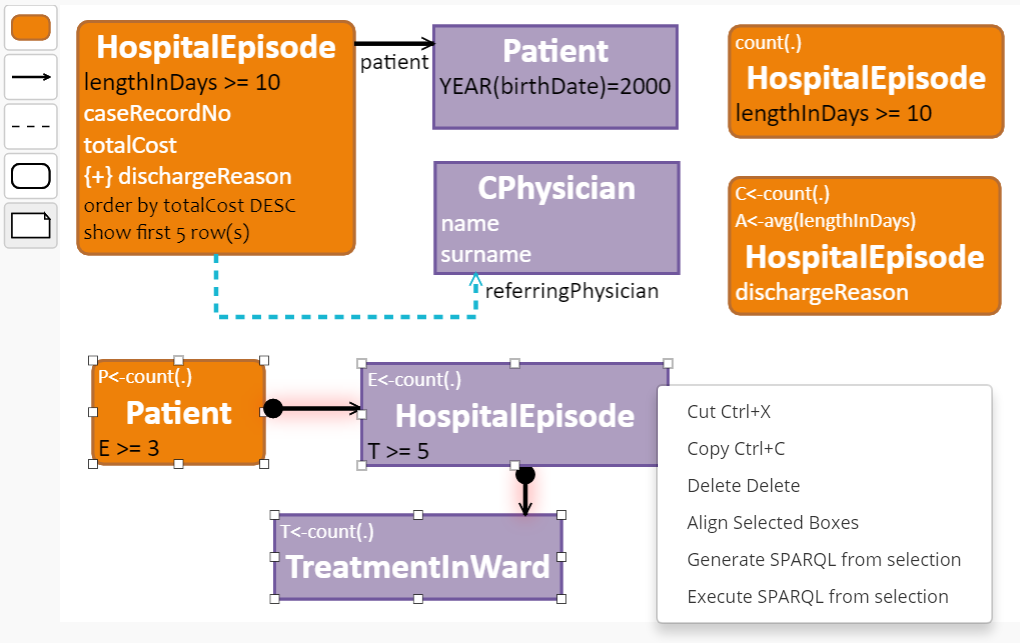
ViziQuer/web main page
|
Visit ViziQuer/web main page for the most recent developments of the visual query tool.
|
|
Tool environment
|
Try the tool online to graphically construct and execute rich data analysis queries over RDF data
Consult ViziQuer/web main page for introduction to the tool
and resources to set up new user projects.
Check out the code to set up the tool locally.
|
|
Query_reading test
|
For hospital data query examples and
user study 1 (query reading ability) queries see
the hospital data example page
|
|
User study (IT: ViziQuer and SPARQL)
|
User study description
User study tasks (01-10 main tasks, 11-16 extra tasks)
Materials available to the participants
SPARQL query test environment printout (every ViziQuer diagram can be switched into
a "SPARQL only" mode showing the SPARQL entry control and the results pane by pressing the "toggle" button on the diagram toolbar)
|
|
Data schema
|
The hospital data schema used in user study project.
See also visualization of the schema (available also in participants' materials)
|
|
Query environment set-up
|
Sign up (create a new user) to the ViziQuer server.
Create an empty project (New project), enter the project name (create two empty projects HospitalA and HospitalB).
Open the HospitalB project and upload the diagram file Hospital_B.json
Use the 'Upload project' button: 
For HospitalA project create a new diagram, or upload empty diagram from Hospital_A.json
Import the data ontology into both HospitalA and HospitalB projects (use the ‘Import ontology’ button from the project toolbar):

Check that in the project settings pane the setting SPARQL Endpoint has the value http://192.168.100.12:8833/sparql
and the Named Graph is set to MiniBkusEN_1 (the settings should be there, if the project is imported, in any case they can be
adjusted manually).
The settings: 
|
|
Core team
|
Prof. Karlis Cerans
Dr. Agris Sostaks
Dr. Arturs Sprogis
Dr. Lelde Lace
Dr. Uldis Bojars
Dr. Juris Barzdins
Julija Ovcinnikova
Mikus Grasmanis
We work at Institute of Mathematics and Computer Science, University of Latvia
|
|
Earlier research
|
K.Cerans, J.Barzdins, A.Sostaks, J.Ovcinnikova, L.Lace, M.Grasmanis and A.Sprogis.
Extended UML Class Diagram Constructs for Visual SPARQL Queries in ViziQuer/web
In Voila!2017, CEUR Workshop Proceedings, Vol.1947
K.Cerans, J.Ovcinnikova. ViziQuer: Notation and Tool for Data Analysis SPARQL Queries.
In Voila!2016, CEUR Workshop Proceedings, Vol.1704
K.Cerans, J.Ovcinnikova, M. Zviedris. SPARQL Aggregate Queries made easy with Diagrammatic Query Language ViziQuer.
In ISWC 2015 Posters & Demonstrations Track, CEUR Workshop Proceedings, Vol.1486
K.Cerans, J.Ovcinnikova, M. Zviedris. Towards Graphical Query Notation for Semantic Databases. In BIR 2015, Springer LNBIP.
G. Barzdins, S.Rikacovs, M. Zviedris. Graphical Query Language as SPARQL Frontend.
In Local Proceedings of 13th East-European Conference (ADBIS 2009), pp. 93-107. Riga Technical University, Riga. (2009)
G.Barzdins, E.Liepins, M.Veilande, M.Zviedris, "Ontology Enabled Graphical Database Query Tool for End-Users",
Selected papers from DBIS'2008, Hele-Mai Haav (Eds.), Frontiers in Artificial Intelligence and Applicatons series, IOS Press, 2009. 187:105-116
|


